
Volume I: Risk Preferences, Risk Sources and Optimal Enterprise Based Asset AllocationTM
Executive Summary
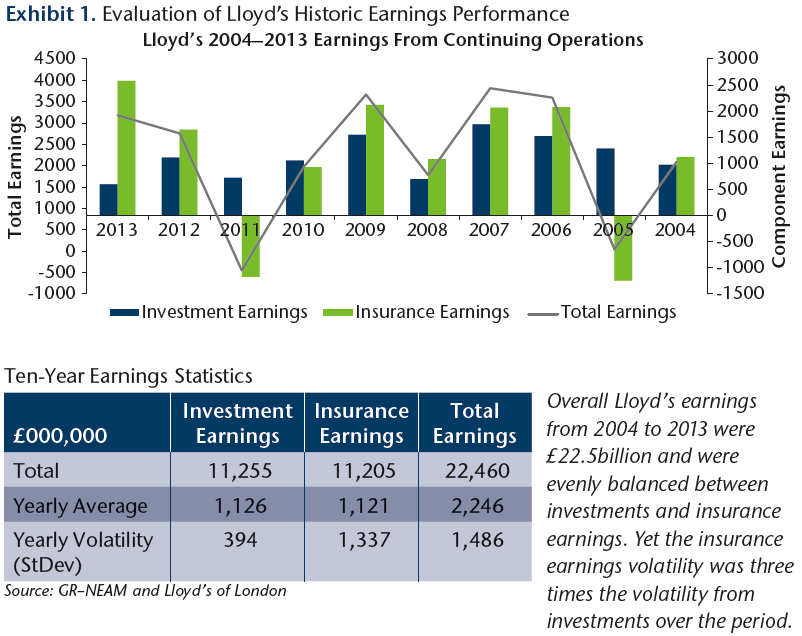
Lloyd’s managing agents and syndicates are parts of a unique insurance marketplace, the structure and strategy of which influence an investment risk profile where conservatism may outweigh efficiency. It would be reasonable to suggest that many Lloyd’s participants’ decisions on setting insurance risk budgets have been predicated on maintaining investment risk to relatively modest levels.1 Specifically, keeping investment risk very low to support uncertainty regarding the performance of insurance assumed over the period. This imbalance is interesting since investment-driven earnings have contributed to half of Lloyd’s total earnings over the past 10 years, and with 70% less volatility compared to insurance operations over this period (see Exhibit 1).2
GR–NEAM will explore the implications of such risk preferences, and other related concepts, across a series of thought pieces over the next several months. These ideas will be assessed in the context of our analytical framework called Enterprise Based Asset Allocation™ process to show how optimal investment portfolios can be structured. Such insights could support better risk-based decision making among investment, operational and risk managers, leading to better use of capital, enhanced earnings and elevating enterprise valuations.
Exhibit 1. Evaluation of Lloyd’s Historic Earnings Performance
Understanding Drivers to Enterprise Risk-Adjusted Returns
A profit-seeking insurance organization such as Lloyd’s is intent on generating favourable returns on equity (ROE) for its capital providers. Following the tradition of a DuPont decomposition, there are four drivers to ROE for an insurer after adjusting for taxes: insurance margin (i.e., 1 – the combined ratio), premium leverage (i.e., net written premiums divided by capital), returns on invested assets (i.e., investment gains and income divided by invested assets), and investment leverage (i.e., invested assets divided by capital).3 (see Exhibit 2.)
Exhibit 2. DuPont Decomposition of an Insurer’s Return on Equity

Generating earnings is not without risk. With higher leverage the respective impacts of insurance and investment returns, as well as the underlying volatility from these areas, is elevated. Obviously, insurers are in the business to assume those risks to which they have capacity to fully understand. Moreover, most insurers now practice prudent enterprise risk management, which embraces the notion that interactions among assets and liabilities, coupled with their individual attributes, are factors that collectively drive risk-adjusted returns for the enterprise. However, a typical asset management process borrows from modern portfolio theory where an efficient frontier of optimal mean and variance trade-offs guide asset-only allocations. Moreover, such trade-offs typically ignore correlations between invested assets and insurance operations.
GR–NEAM’s Enterprise Based Asset AllocationTM (EBAATM) process considers insurance operations and invested assets jointly as the enterprise (portfolio) to optimize, fully embracing an investment philosophy that recognizes both sides of the balance sheet to determine an enterprise’s success (see Exhibit 3). This combined perspective provides a holistic understanding of an organization’s existing risk and return profile. It also guides investment decision making in a more informed way, as opposed to the naïve approach of managing insurance operations and investments in independent silos.
Exhibit 3. Illustration of an Enterprise Based Efficient Frontier
Decomposing an Enterprise Risk Profile
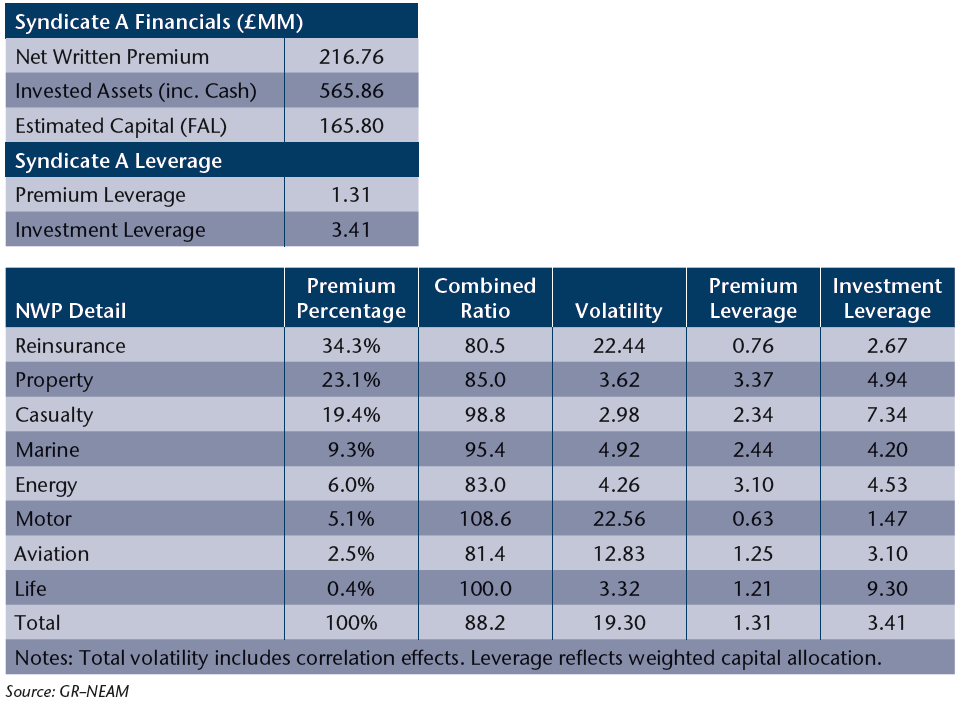
Consider a fictional Lloyd’s syndicate operation called Syndicate A. Syndicate A undertakes eight insurance lines of business, similar to what’s reported by overall Lloyd’s (property, energy, marine, life casualty, motor, aviation and reinsurance), and invests in six asset classes (sovereigns, investment grade corporate bonds, structured securities, bank loans, high-yield bonds and equities).4 It is assumed that Syndicate A will maintain a premium leverage of 1.3x capital and an investment leverage of 3.4x capital. These ratios align to Lloyd’s overall year-end 2013 reported leverage values.5 Historic Lloyd’s insurance performance statistics will be used to estimate expected risk and return characteristics for each insurance line. GR–NEAM’s proprietary views of prospective total income and price return and risk estimates are used for all available asset classes, reflecting an explicit assumption that all asset positions are marked to market. GR–NEAM’s calculation of historical correlations across invested assets and insurance lines are also included. Notable assumptions for the insurance operations are outlined in Exhibit 4.
Exhibit 4. Assumed Risk and Return Characteristics of Syndicate A’s Insurance Operations and Selected Financial Data
The success of an ERM construct is largely predicated on an organization being fully aware of its risk bearing capacity, and structuring its overall risk appetite at levels within that capacity. One way to measure this is with capital, such as limiting the exposure of capital to downside risk events at a certain level of confidence. Value-at-Risk (VAR) is a downside risk metric, and an insurer might define its risk appetite as maintaining a VAR at a desired confidence level that a loss of capital will not exceed a certain percentage over a period of time. Tail-VAR (T-VAR) builds on VAR and considers the expected loss given a VAR threshold that has been exceeded. For Syndicate A, based on the assumed risk and return characteristics noted above, we estimate its current enterprise risk profile to exhibit a 99.5% VAR of 23% of capital and a corresponding T-VAR of 26%, both considering a 12-month horizon (see Exhibit 5). Simply stated, over the course of the following year we estimate that Syndicate A can be 99.5% confident that it will not lose more than 23% of capital due to significant downside risk events.
Exhibit 5. Estimated Risk Partition of Syndicate A’s Existing Enterprise Risk Profile Based on Available Aggregate Lloyd’s Data and Certain GR–NEAM Assumptions
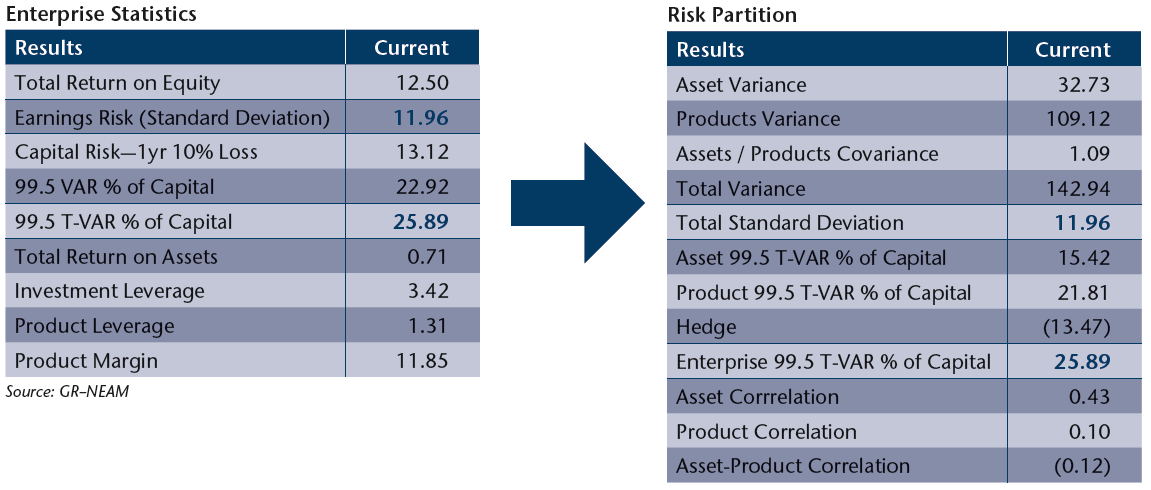
Partitioning the risk profile identifies to what extent overall earnings volatility is driven by investments or insurance operations, and whether the difference between the two are aligned with management’s expectations. In Exhibit 5 we show the risk profile for Syndicate A. The standard deviation of ROE is just under 12, and squaring that number provides a variance of 142.94 which we can use to partition the sources of earnings risk to the enterprise. In this illustration, levered variance of insurance returns is not only estimated at 109.12 but is over three times the variance of investment returns and accounts for 76% of the overall variance6 of returns to the enterprise.
This bias is echoed when considering T-VAR, where the expectation is 25.89% of loss of capital at a 99.5% confidence level due to significant downside returns.7 Decomposing the enterprise T-VAR shows that the insurance portion of tail risk is projected at 21.81% of capital versus 15.42% from investments. This supports the presumption that Lloyd’s syndicates’ risk budgets are heavily biased towards insurance.8
Correlations are important inputs in measuring enterprise risk and return. To the extent correlations between variables are less than one, then these variables do not always behave in exactly the same way. As a result, diversification benefits may be realized. Exhibit 5 shows the aggregate correlations for invested assets, insurance products and the cross correlation between assets and products.9 These are based on historical trends that GR–NEAM tracks.10 In this example, based on GR–NEAM’s estimates, assets are moderately correlated with each other at 0.43, products show very little correlation at 0.10, and correlation across assets and liabilities is slightly negative at -0.12.
As Syndicate A’s management team considers a target risk profile, they may ask questions such as: Is our capital at risk at appropriate levels? Are we taking the right sources of insurance risk?11 Are investment risk levels optimal considering our operational objectives and risk budgets? Are we aligned to our peers or highly rated insurers? A risk partitioning exercise informs management of the sources of risk across the balance sheet. This information helps to (re)define an appropriate enterprise risk appetite, upon which risk budgets can be fine-tuned.
Applying an Enterprise-Based Asset Allocation™ Process
Syndicate A’s risk profile serves as a starting point to consider alternative optimal asset allocations. For example, we have estimates of expected ROE, earnings volatility and T-VAR. For each metric, we can structure an optimal asset allocation that enhances return or reduces risk relative to the current enterprise structure. Exhibit 6 highlights statistics of just three alternative asset allocations relative to Syndicate A’s current positions, albeit there are infinite possibilities across an efficient frontier of optimal portfolios. For example, keeping T-VAR estimates constant, expected after-tax ROE can improve by 143 basis points to 13.93% over the projected 12.50% ROE of the current portfolio. This same portfolio increases expected return on invested assets by an estimated 47 basis points.
Exhibit 6. Enterprise Risk and Return Statistic of Syndicate A’s Current and Alternative Portfolio Allocations
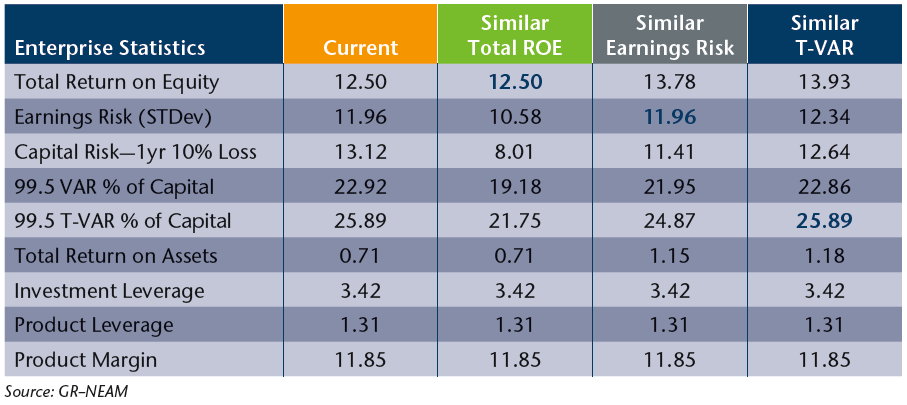
Exhibit 7 shows the efficient frontier for Syndicate A as described in Exhibit 3 on page 2. The coloured symbols correspond to the coloured column headings in Exhibit 6. Parameter assumptions and portfolio constraints (e.g., asset class limits, duration, credit quality) will influence the shape of the frontier, but we kept this to reasonable levels consistent with other Lloyd’s clients we assist.
Exhibit 7. Efficient Frontier and Corresponding Projected Income
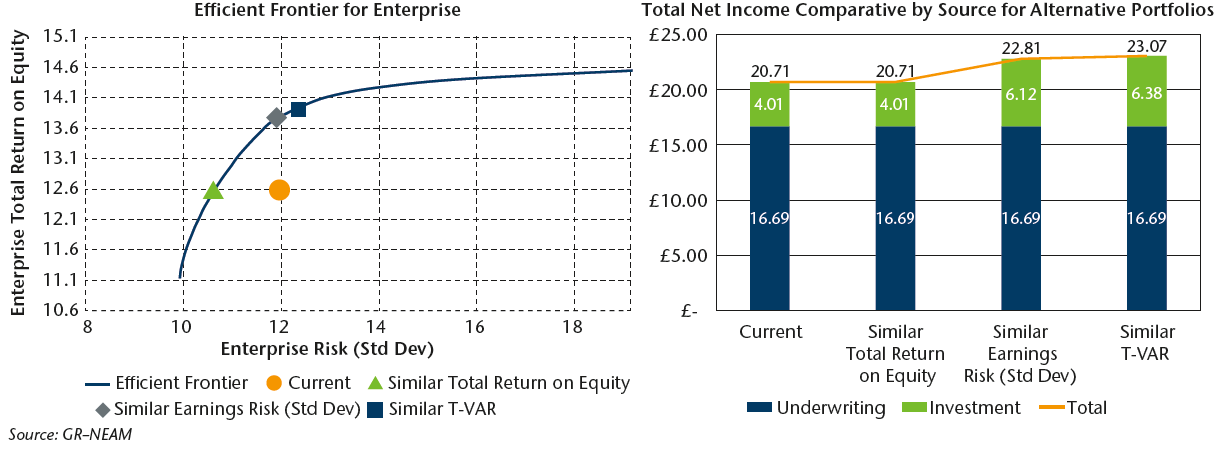
In this illustration we assume that Syndicate A’s insurance operations are static. The current mix of products and percentages of net written premium by line are fixed per the Lloyd’s 2013 reported premium levels. That said, GR–NEAM’s EBAATM process can accommodate variability with insurance products just as it can with assets, allowing evaluation of different reinsurance structures, new premium growth opportunities, mergers and acquisitions and other operational considerations impacting the enterprise. In this illustration, Syndicate A is expected to increase income to the enterprise by an estimated £2.1million (see Exhibit 7) while maintaining the existing enterprise risk profile. This expectation might increase further with dynamic (vs. static) insurance writing forecasts or by introducing additional asset classes to the investment set.
Enterprise risk and return statistics are only a starting point. Not to be overlooked are micro-level asset risk measures and sectors allocations. Duration, credit quality, Solvency II and rating agency market risk-based capital charges may make an otherwise efficient portfolio unfeasible depending on Syndicate A’s objectives. For example, as shown in Exhibit 8 Syndicate A, like most Lloyd’s syndicates, maintains a fairly short asset duration of approximately 2.0 years. The potential enhanced returns and income suggested by the similar T-VAR portfolio elevates expected duration to 2.92 years, with a modest increase to total return volatility to 12.34.
This option is supported by a more balanced allocation between sovereigns and corporate bonds (37% and 30%, respectively), and increased allocations to risk
assets and structured securities (34% and 10%, respectively). As mentioned, these portfolios suggest potential increases to projected return on invested assets and return on equity of 47 basis points and 143 basis points, respectively. However, such increases must be measured against the cost of elevated S&P and SII related market risk capital charges, which rise by approximately 86% and 90%, respectively, in this example (see Exhibit 8).
Exhibit 8. Efficient Enterprise Portfolios Sector Allocation Current Similar
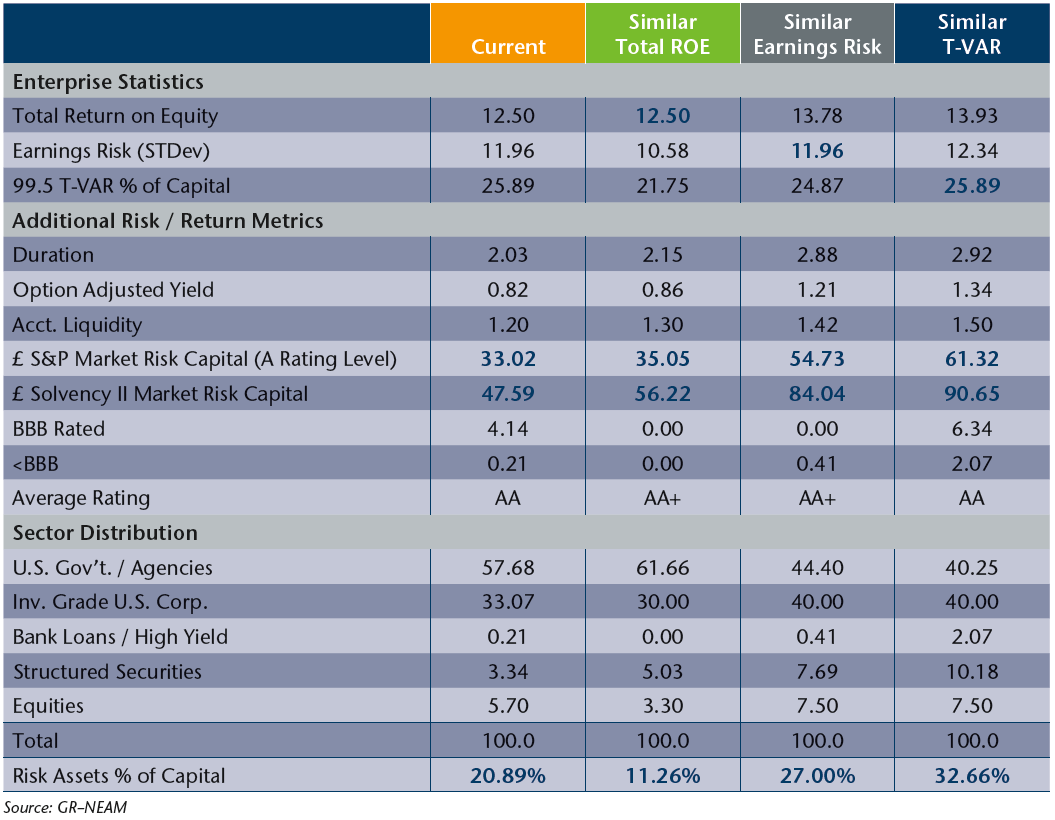
Operational restrictions such as capital charges or limits on credit quality, duration, liquidity, etc. might override the feasibility of an otherwise efficient portfolio opportunity. A joint view of enterprise risk dynamics, coupled with asset specific risk characteristics, would need to be weighed against any potential ROE improvements. Syndicate A’s management would decide which criteria is most important. As these portfolio considerations are weighed, multiple aspects of capital management, including risk budgeting, capital allocation, dividend policy, etc. can be assessed more thoughtfully.
Final Thoughts
GR–NEAM’s Enterprise-Based Asset AllocationTM process demonstrates different enlightening things. At centre is how a more in-depth and coalesced analysis of the sources of return and risk across the enterprise facilitates a thoughtful understanding of risk capacity utilization and the degree of capital-at-risk to which a Lloyd’s syndicate is exposed. The influence that premium leverage and investment leverage have on returns on equity were measured, in part considering the Lloyd’s 2013 annual filings as a proxy. Certain assumptions based on industry data, or reasonable estimates to the extent public data was not readily available, were used.
Historically, investments have contributed equally to Lloyd’s earnings, and with much less risk relative to insurance operations. Through an EBAA™ process, different ways to optimize and potentially enhance risk-adjusted returns within a syndicate’s existing risk appetite can be identified. This can evaluate the impact of alternative asset allocations, but also consider more optimal usage of risk capacity. We focused on just a few portfolio alternatives, but there would be numerous possibilities along the efficient frontier; the ideal choice on that frontier would control for those preferences that management deemed most important. As a result, silos of insurance and investments are reduced, facilitating an improved foundation for decisions around risk and capital management.
When GR–NEAM calibrates our analytics with those from clients, characteristics surrounding insurance product performance, cusip level asset positions, correlations, and operational and financial data that are unique to that organization are reflected in our process. GR–NEAM takes particular interest in stress testing and scenario testing key assumptions and parameters in any risk analysis. This fosters a perspective of the consequences of being wrong, which helps us and our clients make more informed investment and risk management decisions. The end result potentially paves the way for a combination of higher risk-adjusted returns, earnings stability, capital management efficiencies, favourable ratings traction or increased valuations.
In subsequent case studies on Syndicate A, GR–NEAM will explore other considerations in the investment management process. Some topics that we plan to evaluate include:
> Exploring risk capacity and considerations in setting risk budgets
> Understanding and accounting for correlation risk
> The impact of different portfolio constraints
We also invite other topics of interest that readers might suggest.
Endnotes
1 This might be partially attributed to the legacy of Reinsurance to Close (RITC) transactions used to support the typical three-year lag of closing out an underwriting year of account for a syndicate’s operations. This process added a degree of uncertainty in measuring the ultimate risk associated with historic insurance writings. The impact of corporate capital backing Lloyd’s syndicates should reduce the influence of RITC on investment strategy
over time.
2 To isolate Lloyd’s investment performance from insurance operations, syndicate investment returns are removed from the Lloyd’s reported technical account result and added to the investments results captured in Lloyd’s non-technical returns line item. Therefore, insurance operations is defined as the continuing operations line item from the Lloyd’s reported technical account result less syndicate investment returns.
3 For the sake of this exercise, we assumed a 23% effective tax rate as calculated from the Lloyd’s 2013 financial statements.
4 For the purposes of this example, any foreign exchange exposure is assumed to be hedged naturally through the course of Syndicate A’s normal operations. However, GR–NEAM can easily accommodate non-hedged operations.
5 According to Lloyd’s 2013 annual report showing pro-forma financials, the notional investment return on the Funds at Lloyd’s balance is equivalent to a traditional insurance company’s investment return on capital. Hence the FAL balance is the assumed capital balance for all leverage and return on capital calculations for Syndicate A.
6 The overall enterprise variance of 142.94 includes the impact of leverage. This is decomposed to include asset variance of 32.73, product variance of 109.12 and the covariance of among assets and products of 1.09. One may notice that despite a positive covariance, the correlation is negative. This is due to the normalization of the correlation values, bounding that number between negative one and positive one. Also, the correlation number does not include the impact of leverage.
7 GR–NEAM’s approach to measuring T-VAR reflects intra-period outcomes, recognizing that severe loss events can occur at any time during the period. Embryonic calculations of T-VAR assume that losses only occur at the end the period, a potentially misinformed view.
8 This T-VAR also includes the impact of diversification across the enterprise represented by the hedge of -13.47.
9 In this example we are using observed correlations under normal market conditions.
GR–NEAM tends to stress any assumed correlations to understand the consequences of being wrong.
10 Data includes daily priced asset returns from 1997 to 2013.
11 For example: growing casualty writings versus marine, or evaluating different assumed retentions within reinsurance treaties.


